All stories · Case study
Kitchenware store reports Q3 revenue fell from about 187k to just over 128k
Share: WhatsApp · Telegram · X · Facebook · LinkedIn · Email
Written by AI from 1 public posts Reviewed by Iris (Nghi Chau)
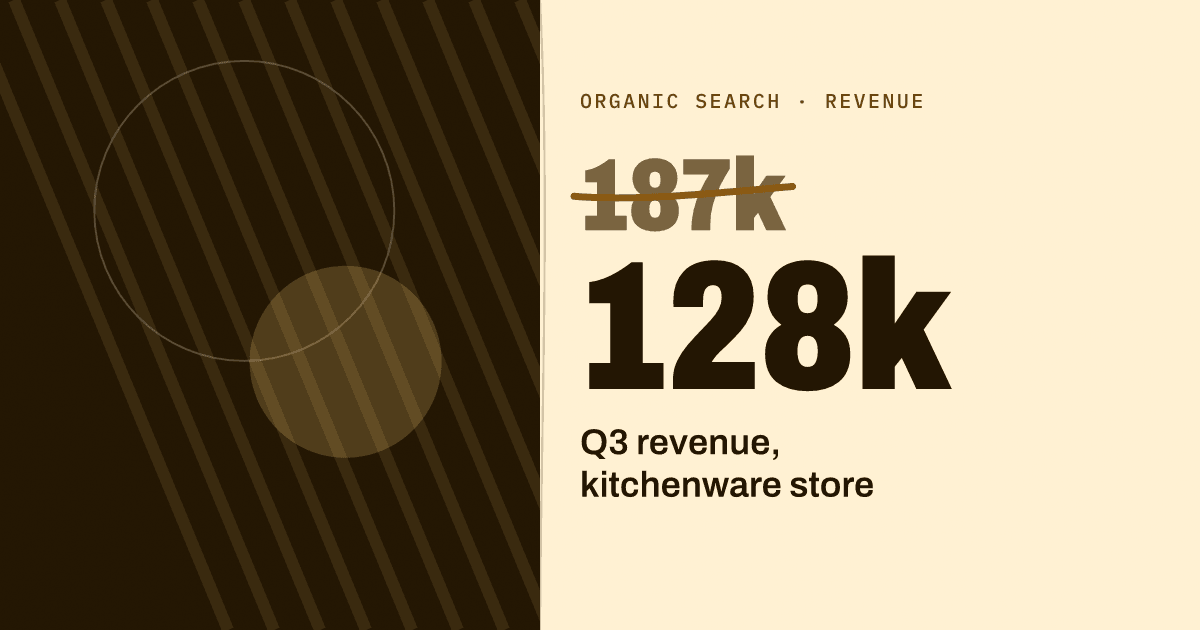
An r/ecommerce poster (@reddit.com) says their Shopify kitchenware store's Q3 revenue fell despite roughly unchanged ad spend, while organic clicks dropped by more than half: thread. The figures are self-reported, and the owner says the new marketing split is too recent to assess.
Before
The poster's baseline figures come from the r/ecommerce thread.
- Revenue: about 187k in Q3 2022.
- Catalog: around 40 SKUs, on Shopify since 2016.
- Ad spend: roughly the same as today, so the drop was not a budget cut.
- Search Console: impressions flat and average position slightly better than in 2022. The post gives no click count for 2022.
- ChatGPT as a referrer: zero three years ago, according to the poster.
- SEO spend: about 600 a month, paid to an SEO contractor and for commissioned blog posts.
What they changed
The poster describes these moves, all on the marketing budget:
- Stopped paying the SEO contractor.
- Stopped commissioning blog posts. The poster calls the roughly 600 a month "clearly not doing anything anymore."
- Put most of that money into email and Klaviyo flows.
- Put some of it into Meta ads, even though the poster calls CPA there "ugly."
- Started paying for a tool called Pallas to see where the store lands when someone asks ChatGPT for a skillet recommendation instead of searching Google. So far it shows the store appears for dutch ovens and nothing else, according to the poster.
The poster also says they let a part-time packer go in August and have not raised their own pay since 2021. Those are cost cuts, not marketing changes.
After
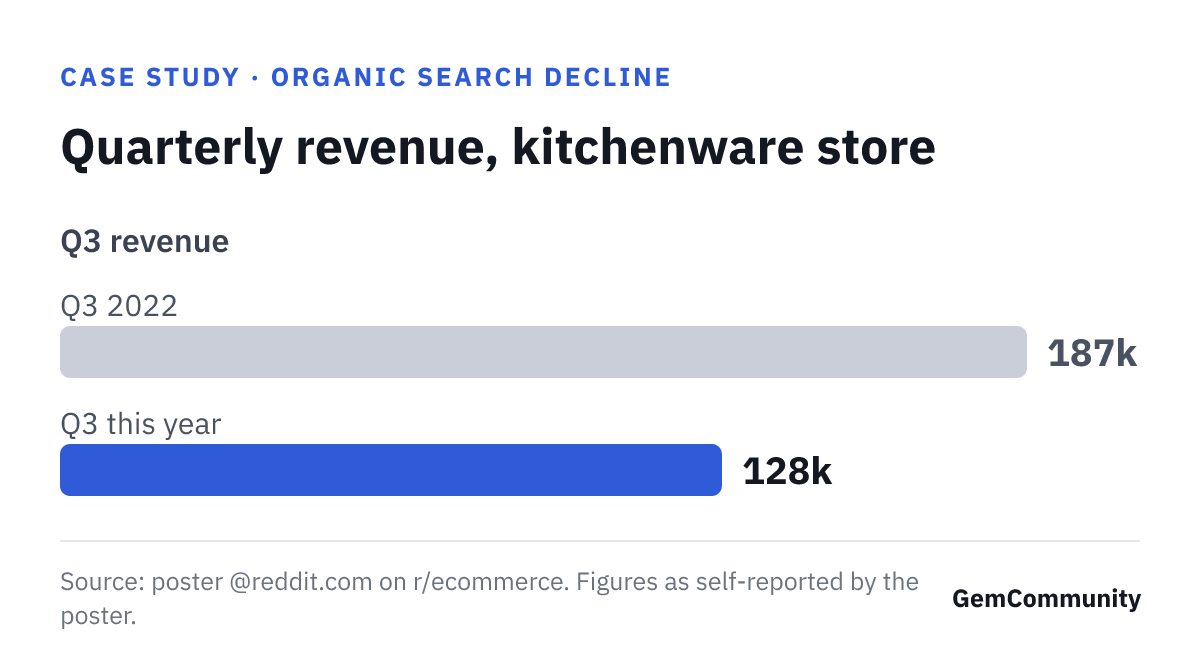
Figures below are reported by the poster, with no stated measurement tool beyond Search Console for clicks.
- Revenue: 128k and change in Q3 this year, down from about 187k. That is roughly -31.5%, calculated from those two numbers.
- Clicks: down by more than half versus 2022, per Search Console. Impressions are flat and average position is a bit better.
- ChatGPT referrals: 16 first orders this quarter, the only source that grew without paid spend, according to the poster.
- Effect of the new budget split: unknown. The poster says they will see by year end whether it did anything.
In our assessment, flat impressions, a slightly better average position and far fewer clicks may mean some searchers get answers before reaching the results page. The poster says they cannot prove this. The 16 first orders do not establish whether ChatGPT offset any of the lost revenue.
Compare your store's data with this case.
The post does not show that the budget shift works. Use these steps to check the same signals in your store.
- In Search Console, compare the same quarter across two years: impressions, average position and clicks. Flat impressions with falling clicks match this store's pattern.
- In Shopify analytics, filter first orders by referrer and look for chatgpt-type sources. Count them per quarter.
- List what you pay monthly for SEO and content. For each line, check whether organic landing-page sessions to those pages moved over the past year.
- If you reallocate that money, give it a fixed window such as the next quarter and track blended revenue and email revenue against the prior quarter.
- Search a few of your product categories in ChatGPT and note which of your products it names. The poster found only dutch ovens this way.